Understanding how time is spent across projects, issues, and team members requires effective reporting on time tracking data. Jira includes native reporting capabilities for time tracking through built-in reports, dashboard gadgets, and data export features, though these capabilities are relatively basic compared to specialized time tracking platforms.
Teams often find they need to supplement native Jira reporting with third-party add-ons or external analytics tools to get the full visibility and analysis capabilities they require. This guide explores what Jira provides for time tracking reporting and where teams typically need additional tools.
How Do I Get Time Reports in Jira?
Jira offers several approaches to viewing and analyzing time tracking data, each serving different purposes and audiences.
Native Jira Reports
Jira Software and Jira Work Management include standard reports that incorporate time tracking data alongside other issue information.
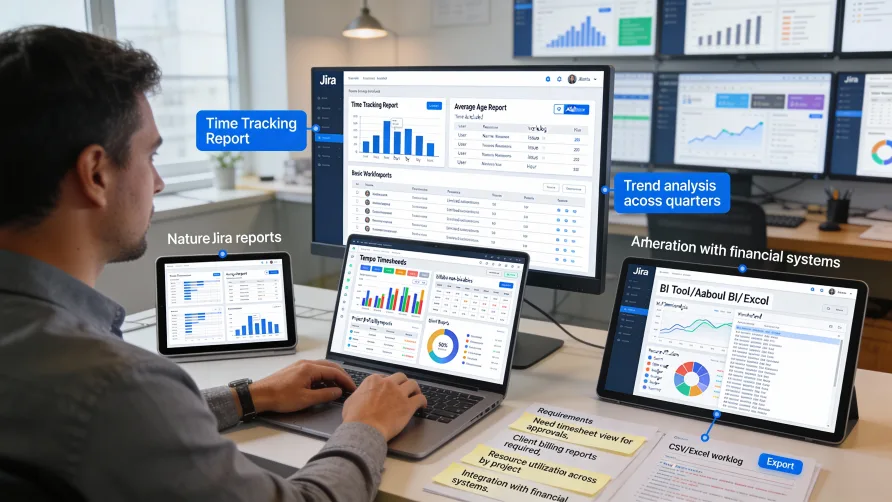
The Time Tracking Report shows estimated and logged time for issues within specified projects or filters. This report displays original estimates, time spent, and remaining estimates across selected issues, providing a summary view of time tracking status.
To access the Time Tracking Report, navigate to Reports in your project sidebar, then select Time Tracking Report from the available report types. You can filter the report by various criteria including issue type, status, assignee, or custom filters.
The report displays data in both tabular and graphical formats. The table view shows individual issues with their time tracking values, while the summary section shows aggregated totals across all included issues.
Sprint reports in Jira Software include time tracking information for sprint issues. These reports show estimated versus actual time for completed and incomplete work, helping teams understand sprint time investment.
The Velocity Report, while primarily focused on story points, can be supplemented with time tracking data through custom configurations or third-party add-ons. Understanding the relationship between velocity and actual hours helps calibrate sprint planning.
User workload reports show issue assignments across team members. While these primarily display task counts and story points, some configurations include time tracking data showing how team members are allocating their time.
Dashboard Gadgets
Jira dashboards support numerous gadgets that display time tracking information in customizable layouts. Dashboards provide at-a-glance visibility into time metrics without navigating to detailed reports.
The Time Since Chart gadget shows elapsed time since issues transitioned to specific statuses. While this measures calendar time rather than logged work time, it provides context for understanding how long issues remain in various workflow stages.
The Filter Results gadget can display time tracking fields for issues matching specified filters. Configure the gadget to show time spent, remaining estimate, or other time-related fields alongside issue details.
Custom gadgets from third-party add-ons provide enhanced time tracking visualizations. These add-on gadgets often display time summaries, team workload distributions, or project time allocation in formats more sophisticated than native gadgets.
Creating effective dashboards requires combining multiple gadgets to tell a complete story. A time tracking dashboard might include filter results showing recent time entries, charts displaying time distribution, and summary statistics about total time logged.
Issue Search and Filters
Jira's issue search functionality provides flexible ways to find and analyze issues based on time tracking criteria.
Jira Query Language (JQL) supports time tracking fields in search queries. You can search for issues where time spent exceeds estimates, where remaining estimates are too low, or where no time has been logged despite work being in progress.
Example queries include:
timespent > originalEstimatefinds issues that exceeded their estimatesremainingEstimate < 1h AND status != Donefinds nearly complete worktimespent is EMPTY AND status = "In Progress"finds active issues without time logged
Search results can display time tracking columns. Configure result columns to show original estimate, time spent, remaining estimate, or work ratio (percentage of estimated time consumed).
Saved filters become reusable reports. Create filters for common time tracking queries, then share them with team members or use them as data sources for dashboard gadgets.
Bulk editing from search results enables mass updates to time estimates. If you need to adjust remaining estimates across multiple issues, search results provide a starting point for bulk modifications.
Can Jira Generate Timesheets?
Native Jira does not include traditional timesheet views where users see calendar-based layouts of their time entries across multiple issues. The closest native functionality is viewing work logs, but this doesn't provide the structured timesheet interface most organizations associate with formal timesheet processes.
Viewing Work Logs in Native Jira
Work logs for individual issues appear in the issue's activity stream. You can see all time entries logged against a specific issue, including who logged the time, when they logged it, duration, and any descriptions.
Issue search results can include time tracking information, providing a list-based view of time across multiple issues. While not a formal timesheet, this approach shows time data for selected issues in one view.
Your personal Jira activity shows issues where you've logged work recently. The activity feed provides a chronological view of your recent actions including time logging, though it intermixes time entries with other activities like comments or status changes.
User-specific filters can show all issues where a particular person logged time within a date range. Combining JQL filters like worklogAuthor = currentUser() AND worklogDate >= -7d creates user-specific time summaries.
Exporting Time Data
Jira allows exporting time tracking data for external processing into timesheet or reporting formats.
Issue export features include time tracking fields. When exporting issues to CSV or Excel, you can include columns for time spent, original estimate, remaining estimate, and work logs.
Work log export is available through various methods. Some Jira versions include direct work log export capabilities, while others require add-ons or API access to extract detailed work log data.
Exported data can be processed in spreadsheet applications to create timesheet views. While this requires manual effort, it's a workable approach for teams needing occasional timesheet reporting without investing in add-ons.
The Jira REST API provides programmatic access to work log data. Organizations with development resources can build custom timesheet reports or integrations by accessing work logs through the API and processing them externally.
Third-Party Timesheet Add-ons
Most teams needing formal timesheet functionality use Jira Marketplace add-ons designed specifically for timesheet management. These add-ons provide calendar-based timesheet views, approval workflows, and enhanced reporting that native Jira lacks.
Timesheet add-ons typically display weekly or monthly calendar views showing all time entries for a user across multiple issues. This format matches traditional timesheet expectations and makes time entry more efficient than logging work on individual issues.
Timesheet submission and approval workflows in add-ons provide formal processes where team members complete timesheets and submit them for manager review before finalization.
Enhanced reporting in timesheet add-ons includes project time summaries, team utilization reports, billable hours analysis, and customizable reports not available in native Jira.
Advanced Time Tracking Analytics
Beyond basic reporting, many organizations need sophisticated analytics to extract insights from time tracking data.
Project-Level Analytics
Understanding time investment by project helps with resource allocation and project management decisions.
Total time by project shows how your organization's capacity distributes across different initiatives. Projects consuming disproportionate time relative to their importance or expected investment need investigation.
Estimated versus actual time comparisons at the project level reveal estimation accuracy. Projects consistently exceeding estimates might need better scope control or more realistic planning.
Time trends over project lifecycles show whether time investment increases, decreases, or remains stable as projects progress. Unexpected patterns might indicate scope changes, team changes, or evolving project complexity.
Team and Individual Analytics
Team-level time tracking analysis helps optimize resource allocation and identify capacity issues.
Team member utilization shows how individuals allocate time across projects and issue types. Understanding utilization helps identify who's overloaded, who has capacity, or whether workload distribution is uneven.
Time by issue type or category reveals what kinds of work consume team capacity. If bug fixes or technical debt consume more time than expected, it affects planning and prioritization.
Productivity trends over time help identify whether team velocity is improving, declining, or remaining stable. Combine time tracking data with completion metrics to understand productivity rather than just hours worked.
Work patterns analysis might reveal insights about when team members are most productive, whether work extends beyond standard hours, or how work distributes throughout the week.
Estimation Accuracy Analysis
Comparing estimated time against actual time logged helps teams improve their estimation skills.
Estimation variance shows which issues, issue types, or complexity levels have the largest gaps between estimates and actuals. Large variances indicate estimation challenges.
Estimation bias analysis reveals whether teams systematically overestimate or underestimate work duration. Some teams are consistently optimistic while others pad estimates with safety margins.
Improving estimation requires acting on variance analysis. Retrospective discussions about why estimates missed lead to action items for better future estimates.
Exporting and Integrating Time Data
Many organizations need to move time tracking data from Jira into other systems for payroll, accounting, or advanced analytics.
Export Formats and Methods
Native Jira export functions support several formats for time tracking data.
CSV and Excel exports include time tracking fields when properly configured. During export, select which fields to include, ensuring time tracking columns appear in the output.
XML export provides more complete data including full work log details. XML exports are particularly useful for data migration or integration with systems that can parse XML.
HTML export creates human-readable reports. While less useful for data processing, HTML exports work well for sharing time tracking summaries with stakeholders who need static reports.
API-Based Integration
The Jira REST API enables programmatic access to time tracking data for custom integrations or automated reporting.
Work log endpoints provide detailed access to time entries including who logged time, when, duration, and descriptions. Applications can query work logs by date range, user, project, or issue.
Issue endpoints include time tracking summary data. API calls can retrieve original estimates, time spent, and remaining estimates for issues, enabling custom reporting without processing individual work logs.
Webhook notifications can trigger when time tracking changes occur. Systems can receive real-time updates when team members log time, enabling immediate processing or analytics.
Custom integrations built on the API can push Jira time data to business intelligence tools, accounting systems, payroll applications, or data warehouses for advanced analysis.
Connecting to External Tools
Many organizations connect Jira time tracking data to external analytics or reporting platforms.
Business intelligence tools like Tableau, Power BI, or Looker can connect to Jira data through direct connectors or by importing exported data. These tools provide sophisticated visualization and analysis capabilities beyond native Jira.
Accounting systems often need time tracking data for cost accounting or project billing. Integration can happen through dedicated connectors, API-based sync, or periodic data exports.
Payroll systems require approved time data for wage processing. Organizations using Jira time for payroll typically implement integration that transfers approved time entries to payroll applications.
Building Effective Time Tracking Dashboards
Well-designed dashboards provide at-a-glance visibility into time tracking metrics that matter for your organization.
Dashboard Design Principles
Effective dashboards focus on specific audiences and questions. A developer dashboard emphasizes personal time tracking, while a management dashboard summarizes team-level metrics.
Limit dashboards to essential information. Too many gadgets create information overload rather than clarity. Include only metrics that inform decisions or actions.
Update frequency matters for dashboard utility. Real-time or near-real-time data helps with current decision-making, while historical dashboards inform retrospective analysis.
Visual hierarchy guides attention to the most important information. Place critical metrics prominently and use size, color, or position to emphasize key data.
Common Dashboard Configurations
Project manager dashboards typically show current sprint or project time summaries, team workload, and recent time entries. These dashboards support day-to-day project oversight.
Team member dashboards emphasize personal time tracking including recent entries, weekly totals, and remaining estimates for assigned work. Individual dashboards help people manage their own time tracking.
Executive dashboards aggregate high-level metrics like total time by project, team utilization, and time tracking compliance. Leadership needs summary data rather than detailed issue-level information.
Client-facing dashboards might show billable hours, project progress based on time tracking, or milestone completion. These dashboards support client communication and transparency.
Best Practices for Time Tracking Reporting
Effective time tracking reporting requires thoughtful implementation and ongoing maintenance.
Regular Review Cadences
Establish regular intervals for reviewing time tracking reports. Weekly reviews for operational decisions, monthly reviews for resource planning, and quarterly reviews for trend analysis create appropriate review rhythms.
Sprint retrospectives should include time tracking analysis for agile teams. Comparing estimated versus actual time informs sprint planning improvements.
Monthly time tracking reviews help identify patterns, address data quality issues, and make resource allocation adjustments before small problems become significant.
Data Quality Monitoring
Monitor time tracking compliance regularly. If substantial work isn't being logged, your reports won't accurately represent reality.
Check for data quality issues like missing time entries, unusual patterns suggesting inaccurate logging, or remaining estimates that haven't been updated.
Address data quality problems promptly through training, process improvements, or technical solutions rather than letting poor data quality persist.
Action-Oriented Analysis
Time tracking reports should inform decisions and actions, not just present data. Every report should answer specific questions or support particular decisions.
Identify action items from time tracking analysis. If reports reveal problems like poor estimation accuracy or resource imbalances, define concrete steps to address the issues.
Close the feedback loop by acting on time tracking insights. Teams lose motivation to track time accurately when the data never influences decisions or improvements.
Privacy and Sensitivity
Balance transparency with appropriate privacy. While team-level time tracking analysis supports process improvement, excessive individual-level scrutiny can feel invasive.
Use time tracking data for process improvement rather than performance evaluation. Frame analysis around how the team can improve collectively rather than judging individuals.
Communicate how time tracking data will be used. Transparency about reporting purposes reduces concerns and builds trust around time tracking practices.
Getting Started With Time Tracking Reporting
Begin with native Jira reporting capabilities before investing in third-party tools. Understand what Jira provides and where you genuinely need additional functionality.
Identify your key time tracking questions. What do you need to know about how time is spent? Which decisions require time tracking data? Clear questions guide report design.
Start with simple dashboards or reports addressing your most important questions. Add complexity only as needed rather than building comprehensive reporting immediately.
Test reports with actual users. Verify that reports provide useful information in formats that make sense for the people who need them.
Iterate based on feedback and usage. Add reports that prove valuable, eliminate reports that nobody uses, and refine existing reports based on how people interact with them.
Consider third-party add-ons when native Jira capabilities don't meet your needs. Evaluate whether the value of enhanced reporting justifies the additional cost and complexity.